20Sep

Elliott Wave Technical Analysis and Stock Forecast for Dr Reddy's Laboratories: Key Insights and Price Targets

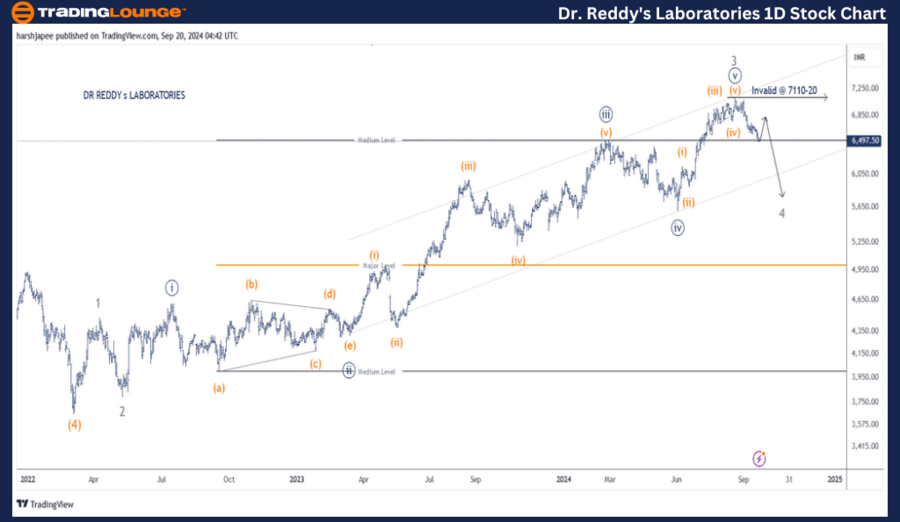
DR REDDY'S LABORATORIES – DRREDDY (1D Chart) Elliott Wave Technical Analysis

DRREDDY Elliott Wave Technical Analysis

Function: Counter Trend (Minor Degree, Grey)

Mode: Corrective

Structure: Zigzag/Flat Unfolding

Position: Impulse drop complete at Minuette Degree (not labelled)

Details: The Minuette impulse wave appears complete within Minor Wave 4 Grey, near the 7110-20 level. If accurate, a slight pullback higher is expected before the price turns lower again.

Invalidation Point: 7110-20

Dr Reddy's Laboratories Daily Chart: Technical Analysis and Elliott Wave Counts

Dr Reddy's Laboratories daily chart suggests a potential correction is underway, likely progressing towards the 5600 level as Minor Wave 4 unfolds. Minor Wave 3 Grey seems to have completed at 7110, which was recorded on August 21, 2024. A zigzag corrective pattern appears to be forming against this high.

In March 2022, Dr Reddy’s registered a low around 2645, marking the termination of Intermediate Wave (4) Orange. From that point, Intermediate Wave (5) has been advancing, with Minor Waves 1 through 3 already completed. Minute Wave ((iii)) has extended, ending around the 6500-10 range.

If this count holds, Minor Wave 4 is likely advancing towards the 5600-10 range, aligning with the previous fourth wave of a lower degree against the 7110 high. Alternatively, if Minute Wave ((v)) is still progressing within Minor Wave 3, the price could push beyond the 7110-20 level.

DR-REDDYS-1d-stock-c...


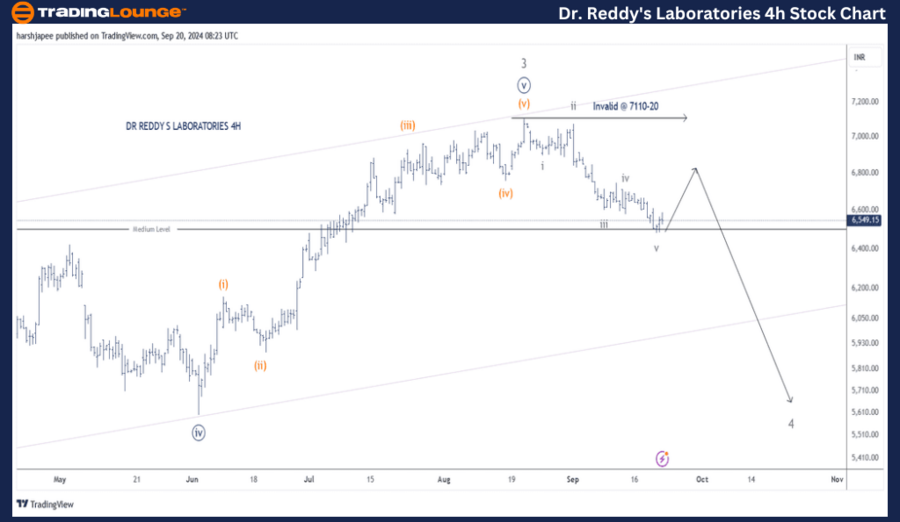
DR REDDY'S LABORATORIES – DRREDDY (4H Chart) Elliott Wave Technical Analysis

Function: Counter Trend (Minor Degree, Grey)

Mode: Corrective

Structure: Zigzag/Flat Unfolding

Position: Impulse drop complete at Minuette Degree (not labelled)

Details: The Minuette impulse wave seems to have completed within Minor Wave 4 Grey, around the 7110-20 range. This could represent Wave (a) of a potential Zigzag. If confirmed, expect a slight pullback higher before the price turns lower again.

Invalidation Point: 7110-20

Dr Reddy's Laboratories 4H Chart: Technical Analysis and Elliott Wave Counts

The 4H chart for Dr Reddy's Laboratories highlights sub-waves within Minute Wave ((v)) of Minor Wave 3. The impulse wave may have completed near the 7110-20 level. The subsequent decline towards 6490 appears as an impulse at the Minuette degree.

If this analysis is accurate, prices should see a brief upward move towards 6790 to complete a corrective wave before resuming a downtrend.

Technical Analyst: Harsh Japee

Source: visit Tradinglounge.com and learn From the Experts Join TradingLounge Here 

Previous: TATA STEEL Elliott Wave Technical Analysis 

VALUE Offer - Buy 1 Month & Get 3 Months!Click here

Access 7 Analysts Over 200 Markets Covered. Chat Room With Support


DR-REDDYS-4h-stock-c...

Conclusion:

Dr Reddy's Laboratories is currently moving lower within a counter-trend zigzag pattern, with Minor Wave 4 Grey expected to terminate near the 5600 level. Once this correction completes, the larger degree uptrend is likely to resume, aiming towards the 7110-20 zone.

Related

Detailed Analysis Covers Cocoa Commodity Elliott Wave Technical Analysis

Detailed Analysis Covers Cocoa Commodity Elliott Wave Technical Analysis

Discover the intricacies of Elliott Wave Analysis applied to cocoa trading. This detailed analysis c...

Read More >
Commodity Market Update: Forecast for Gold, Silver, and Base Metals Amid Rising US Dollar and Treasury Yields

Commodity Market Update: Forecast for Gold, Silver, and Base Metals Amid Rising US Dollar and Treasury Yields

This commodity market update highlights expectations for key financial instruments and commodities i...

Read More >
Insights to Support Informed Trading Decisions: British Pound/U.S. Dollar (GBPUSD) Forex Elliott Wave Technical Analysis

Insights to Support Informed Trading Decisions: British Pound/U.S. Dollar (GBPUSD) Forex Elliott Wave Technical Analysis

This article provides a thorough Elliott Wave analysis for GBPUSD, covering both daily and 4-hour ch...

Read More >
Unlocking Market Potential: SP500 at 5000 and Nasdaq 100 at 18000 Resistances - Elliott Wave Analysis Update

Unlocking Market Potential: SP500 at 5000 and Nasdaq 100 at 18000 Resistances - Elliott Wave Analysis Update

SP500 at 5000, Nasdaq 100 near 18000 resistance. Markets may temporarily breach, but gravitational p...

Read More >
Unlocking ASX Trading Success: BLOCK INC. - SQ2 Stock Analysis & Elliott Wave Technical Forecast

Unlocking ASX Trading Success: BLOCK INC. - SQ2 Stock Analysis & Elliott Wave Technical Forecast

Our detailed Elliott Wave analysis for ASX BLOCK INC (SQ2) offers insights into the stock’s forecas...

Read More >

Buy 1 Month

Get 3 Months!

Special Offer:

Trade Recommendations

Unleash the power of deversified trading with our comprehensive portfolio, covering:

  • Stock Trades
  • Crypto Trades
  • Forex Trades
  • Commodity Trades
Elliott Wave Analysis

Gain a competive edge with expert insights in to:

  • Global Indices
  • US Stocks & ASX Stocks
  • Forex & Crypto
  • Commodities
Top-Notch Trading Tools

Equip yourself with the tools of success:

  • Social Chat
  • Elliott Wave Algorithm
  • Screener
  • TradingLevels
  • Trading Game
7 Elliott Wave Analysts

Stay ahead of the market with daily charts and insightful videos
-Your secret to strategic trading!

JOIN HERE


Welcome to TradingLounge (ASIC A.R.No. 321187), specialists in trades, trading education and technical analysis, covering stocks, indices, commodities, forex and cryptocurrencies.

When you join TradingLounge you have access to everything we offer, including trade tools, educational content and a social platform to chat with like-minded investors.

Read more

@Copyright 2024 by tradinglounge.com

Contact Us

Australian no: 02 4787 6020

International no: +61 (2) 47876020

Pay with:

Find us on